
The link is full—but why?
SNMP utilization shows a busy interface, but not which endpoints, ports, protocols, or conversations are filling it.
Network traffic analysis
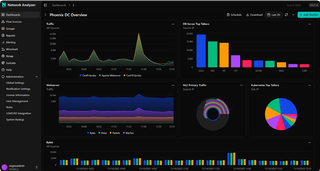
Nagios Network Analyzer turns NetFlow, sFlow, jFlow, and IPFIX into answers: which endpoints are talking, which ports and protocols are involved, and what is consuming the bandwidth.
Interface utilization can tell you something is wrong. The harder part is explaining what happened before the ticket, call, or outage becomes the only evidence.
SNMP utilization shows a busy interface, but not which endpoints, ports, protocols, or conversations are filling it.
Intermittent congestion is difficult to diagnose when the traffic has disappeared by the time someone starts investigating.
Capacity planning, recurring incidents, and post-event analysis depend on retaining the flow data that actually matters.
Flow records, path data, packet capture, discovery, and security context are more useful when an investigation can stay connected.
Flow-level visibility
Nagios Network Analyzer collects NetFlow, sFlow, jFlow, and IPFIX and breaks traffic down by source, destination, port, protocol, flows, packets, and bandwidth.
Saved queries, Traffic Profiles, thresholds, and retention controls help you investigate what happened and keep the history that matters.
Nagios Network Analyzer uses a single perpetual license with no user limit and no per-interface or per-flow software charge.
Current public perpetual license price; first year of Maintenance & Support is included.
Give the network team access without adding software cost per user.
Monitor supported flow sources without licensing each interface separately.
Go beyond flow when needed
Flow data answers who, what, and how much. Network Analyzer 2026 also provides integrated workflows for scheduled traceroutes, Wireshark packet capture, Suricata signature-based detection, and Nmap discovery/port scanning when an investigation needs more context.
MCS can help configure sources, queries, Traffic Profiles, thresholds, retention, and XI integration so the platform becomes part of day-to-day troubleshooting instead of another collector no one checks.
Need to explain what is happening on the network?
Tell us which devices can export flow data, where bandwidth or performance problems occur, and what your team needs to be able to prove after the event.
You do not need a finished flow-monitoring design; the problem you are trying to solve is enough to start.